Dear Mr. Patel:
Thank you for giving me a second chance to make myself clear. Let me offer three kinds of evidence, each leading to a “conclusion,” but of course in science it is really called a theory and since theories are always being overthrown, that is a beginning, not an end. So I shall call them theories.
First kind of evidence: Data suggests that in humans and in animals, the kinship of a couple determines their fertility.
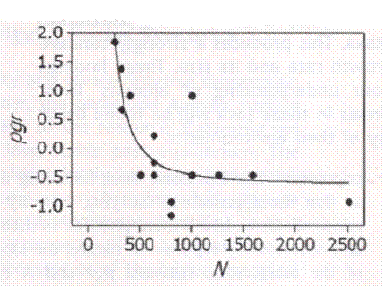
Here is a study that compiled over 1,000 actually almost 2,000 studies of wild animals in which they were counted in the field on a regular basis.
On the Regulation of Populations of Mammals, Birds, Fish, and Insects. Richard M. Sibly, Daniel Barker, Michael C. Denham, Jim Hone, Mark Pagel SCIENCE VOL 309 22 JULY 2005 page 609 figure 1. The vertical axis is the population growth rate. The horizontal axis is the population size as estimated from population density.
As you can see, the population grows the fastest when it is small and its growth falls below zero as the population gets bigger. This was the pattern they found everywhere. Notice that by the time the population reaches 1,000 it is already to big to survive for long at that level. The expectation of course was that at very small populations there is inbreeding and fertility should be low. It should rise until it approaches the carrying power of the environment. Then it should fall rapidly. The facts are very different.
There may be things we don’t know about wild animals, but I think we can agree that they are not postponing families to have a career or wondering how to but their children through college. They just have all the babies they can. Since average kinship is the inverse of population size, it seem clear that when kinship falls too low, population must fall afterwards.
Here is a study done in Iceland. This time they really did compare kinship with fertility. Here is what happens in the first generation, the number of children a couple can have compared with their kinship. They calculated kinship by going back 10 generations and counting ancestors, that far back it seems there were always shared ancestors.
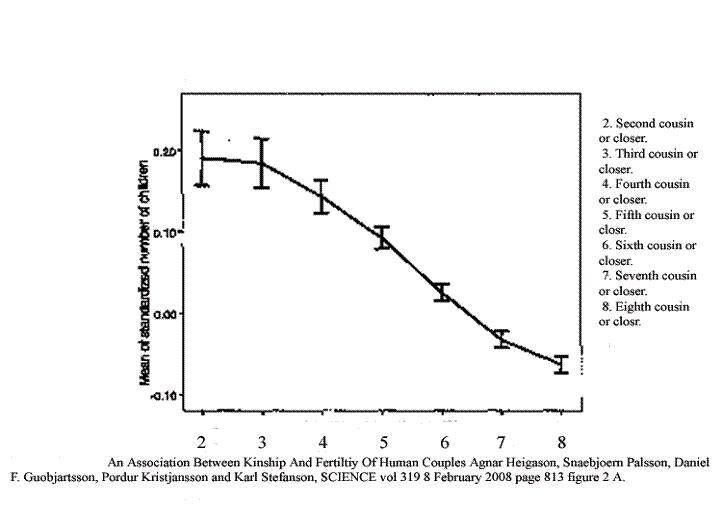
An Association between Kinship and Fertility of Human Couples Agnar Helgason et al. SCIENCE vol. 329 no. 5864 February 8, 2008 page 813 – 816
The animal studies did not show inbreeding depression. However in this study, since the genealogy of Iceland is known very well, it was possible to show at least that fertility was not rising quite so fast at the greatest degree of kinship found.
Helgason and his collegues then went on and looked at what happened to grandchildren.
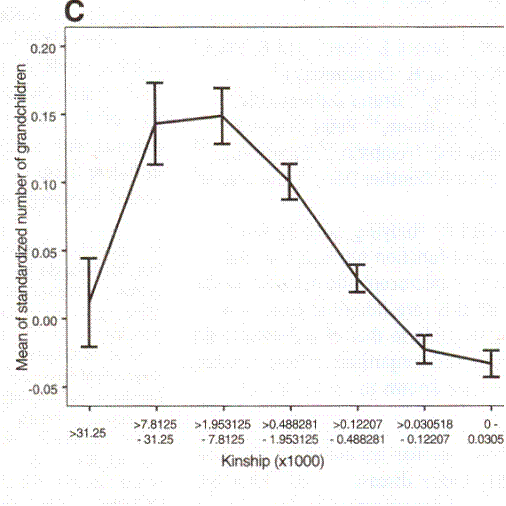
As you can see, at a kinship (as they calculated it) of “second cousin or closer” meaning first cousin once removed, there is a degree of decreased fertility. It is not as low as that for, say, “seventh or eight cousin or closer” but it is lower than for third or fourth cousin. The curve in all essentials is the same. Icelanders do not worry much about feeding their children; it is a socialist country. They might have reason to reduce their fertility voluntarily, but they are certainly not being eaten by foxes. The experience of humans is just the same as that of any other animal.
Another study was done in Denmark. This time they compared fertility with the distance apart a couple was born. Icelanders usually fished or herded sheep, so where you lived didn’t make much difference to where the rest of your family was. Danes have been farmers, so where you lived had a lot to do with where your family was. So the two different ways of measuring kinship are appropriate to the two different cultures. There is one oddity about the Danish study: we have compared fertility with kinship – which is the inverse of the population size. The Danish study compared “marital radius.” That means they were not looking at population size but the square root of population size. This is what they found:
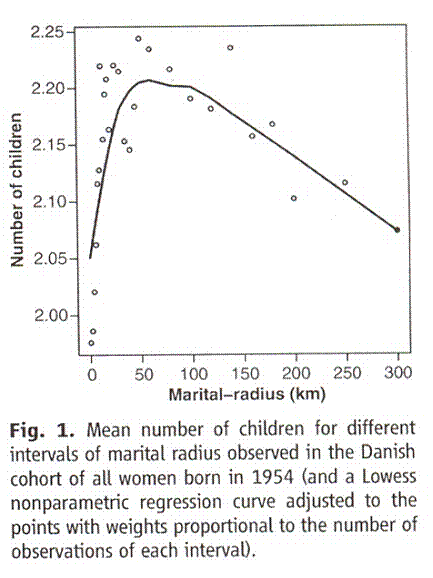
Comment on “An Association between Kinship and Fertility of Human Couples,” Rodrigo Labouriau and António Amorim, SCIENCE vol. 322 no. 5908 December 12, 2008 page 1634. Also see Human Fertility Increases with marital radius. Rodrigo Labourian and Antonio Amorim. GENETICS volume 178 January 2008 page 603
Once you correct for the geometric distortion produced by the distance-area problem, it is the same curve all over. This time there is no estimate of population size. On the other hand, by the time population size in the Icelandic study has reached 1,000, meaning the average kinship is the equivalent of 500, which would be about eight cousin, poputation growth has fallen below average.
The “zero” line on the Icelandic graphs is the “normalized” fertility. It is fertility compared to average. So negative numbers do not necessarily mean negative growth. But in fact since Iceland’s birth rate is about 2.15 births per woman, being below average essentially means having too few children for long term survival.
So those are the facts. They come from many different sources (remember it was over a thousand kinds of animal) and they are not going to go away.
I take these facts very seriously. Many people I know do not take them seriously. That amazes me. If you give up the truth, what do you have left? Maybe love is more important than truth. But is the love true? I keep coming back to truth.
Now comes the theory. Theories can be wrong. In fact they usually have to be corrected regularly as more evidence turns up. A theory is not the truth. It is just an honest attempt to get at the truth. So the obvious theory is that if you want to have babies in your population you should encourage couples to date each other who are third or fourth cousins. Second cousins would be fine. Fifth or sixth cousins would be good. But that about completes it.
Of course before making any such move, a lot of people should talk about it. I can recommend two experts who probably understand it better than I do although so far as I know neither has dedicated his life to it. One is Robin Fox
Rutgers,
57 US Highway 1
New Brunswick, NJ 08901-8554
rfox@rci.rutgers.edu
He is an anthropology professor at Rutgers. He wrote the book Kinship and Marriage, which is a standard and some say the best anthropology text to this day.
The other is Patrick Bateson
ppgb@cam.ac.uk
He is a professor at Cambridge University in Britain and one of a distinguished family of biologists. Bateson coined the phrase “optimal outbreeding” which refers to the “sweet spot” of kinship in animals, which we have seen everywhere. His work also indicates that animal (I think it was Japanese quail) actually prefer cousins they have never seen to unrelated stangers. If that is true in humans (and I do believe it. I’m always falling in love with cousins) then getting cousins of appropriate kinship might not be difficult at all. By all means discuss it. But do not lose sight of the truth.
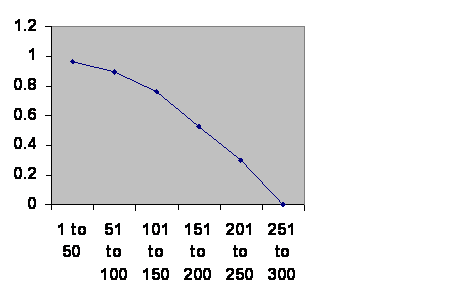 So much for the first kind of evidence. The rest of this I find interesting but is not so important for practical purposes. The second kind of evidence is historical. One could look at that I have shown you and say, “But if that were true, then we would know. Whole civilizations should have vanished because of infertility.” In fact that appears to be the case. Here is a graph of Mesopotamian regimes, the horizontal axis is the age of the regimes and the vertical axis, in 50 year increments, is the chance regimes of that age have of surviving another 50 years:
Information taken from R. H. Carling THE WORLD HISTORY CHART International Timeline Inc. Vienna, VA 1985. This is not perhaps the most prestigious authority, but I have not found him in serious error in the area in question. He is the first place I looked, and if I were to check more sources I might be accused of “shopping” for data.
That is the data, like it or not. Now comes the theory:
The line is so clean that there can be only one cause for regimes to fail. If they failed for outside reasons – climate change, say – the line should be horizontal. If they failed for internal reasons – wrong politics, not flexible enough – the line should go up as the weak were eliminate leaving the strong that would survive longer. But the line goes down. Well if the cause is not outside the population, is not inside the population, and cannot be an average of the two, all you have left is the very existence of a large population. As I have said, the administrators, scholars, officers, engineers, agriculture agents, that is to say the most educated and powerful people in the society who are actually doing the work, all have a broad social horizon. As their fertility goes, so goes the fate of the nation. I could multiply cases looking at different areas and show you plots of the time course of fertility for individual populations of people and mice, but you get the point. There is this ten generation brick wall.
So much for that theory. The question might be asked, “Why in the world would evolution do something so terrible to us?” That introduces the next evidence and next theory.
The third kind of evidence is the observation that populations that are separated for a long time will become different species. That hardly needs support, but let me give you three examples. (And I’m sorry I don’t have the references right at hand.) Mice in the Canary Islands did not arrive until the time of Columbus. Today when they look at the chromosomes of the mice in the different valleys, they are so different that it is clear that each valley has its own species. How long they have been separate is not knowable, but separate they are. So how long is a mouse generation time? It has to be at least a month, since it takes that long for a mouse to mature. But life in the wild is hard. Maybe the average generation time is three months, or four per year. In 500 years there would have been 2,000 generations. It has also been suggested that rabbits in the Azores are a different species from those in Europe. The dates and arguments are about the same, so one would be forgiven for saying 2,000 generations or less to speciation there, too. Camels were domesticated a “few” thousand years ago. Camels are milked, which suppresses ovulation. So the generation time for camels is probably a “few” years. That’s close enough to saying that it has been one or two thousand generations of camels since they were domesticated. The beasts were found to be so valuable that they were promptly exported to Africa, where the one humped dromedary developed in isolation from the two humped Bactrian. The two can be crossed and have fertile offspring, but after a very few generations the line dies out from something called “hybrid breakdown.” In other words, camels have been separated for fewer generations than the mice in the Canary Islands, and their speciation has not gone so far.
Those are the facts. I may hen it wrong. But if so they are errors of fact. The theory is that it takes about two thousand generations for two separate populations of the same species to become different species, and this is a fairly consistent pattern.
Theories can be wrong. But let me elaborate on this one:
Consider a valley with 1,000 animals, say mice. One mouse has a particular normal chromosome.

It replicates and the two copies wind up in two offspring.


One mouse scurries across the valley, glacier splits the valley in two. The glacier remains for two thousand mouse generations. The F2,000 mouse from the far side of the valley returns and mates with an F2,000 mouse from the near side. But they cannot have normal fertile offspring. There has been speciation. (Left side below.)
Now, instead of a glacier, the mice mate at random throughout the valley, the population being constant at 1,000. Since there are 2,000 copies of the chromosome it takes on average 2,000 generations before F2,000 mates with F2,000. The offspring are not fertile. Since this is true of every part of every chromosome in every mouse, the population dies. (Right side below.)
................ ..................
 ...................................
 ......................
 ..........
.................![]() \.
\. .
.![]() .................................
................................. ![]() .....................
.....................![]()
................ .G..
................. l
................. a
................. c
................. i
................. e
................. r
................ ..................
 ....................................
 .................
  ..................F2,000 F2,000 .... F2,000................... F2,000
Obviously this is an event that evolution will not tolerate, so a preventive mechanism must require a couple to share ancestors over the previous 10 generations. Otherwise there will be an eventual population crash.
Of course you might get away from the problem by turning off speciation, but that would mean extinction in the long run. Things are always changing and a population that cannot break into different species will, as niches open and close, ultimately get outflanked by a population that can.
I have reason to think that the mechanism is epigenetic. I am working on getting the chemistry proven, but it will take a year (and I am pretty old, so who knows how long I have?) I am thinking, and it is not really that important. It does not affect what you can and cannot do. (Oh, all right. If we could understand it better, maybe we could control it by other means, but I am most doubtful.)
Thank you for giving me another chance to be clear. I am afraid that my enthusiasm leads me to go on longer than absolutely necessary, but I tried to put the important things up front.
Again, if there is anything at all I can do to help, do let me know.
Sincerely,
Linton Herbert
There have been 67,876 visitors so far.